Determining the ESP8266 power consumption
Intrigued by the schocking revelations from the previous article, I took the ESP8266 to the lab and measured it with a proper oscilloscope.
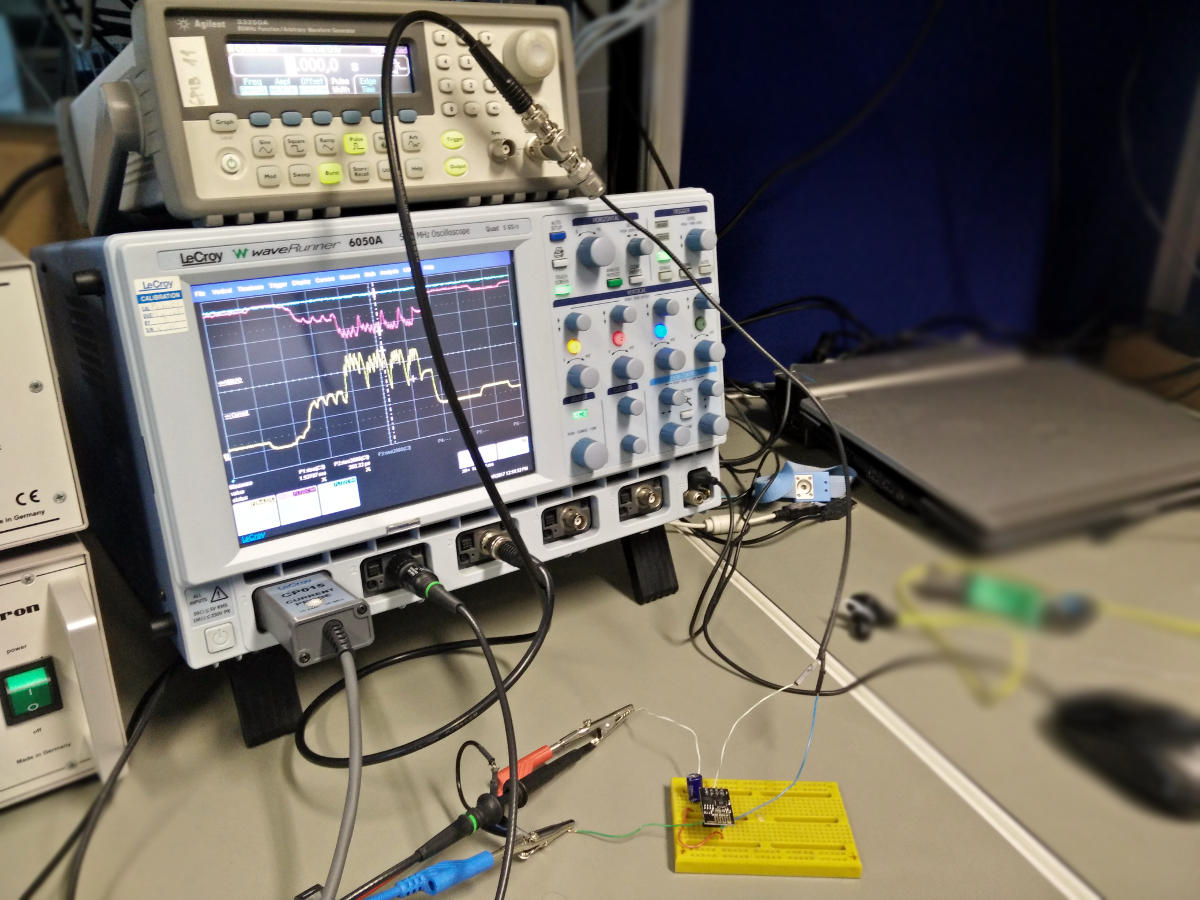
Here I present my measurements, as well as some screenshots of the waveforms. The measurements were performed on an ESP-01 module using LeCroy WaveRunner 6050A and it’s accessory current probe, as pictured (the probe os off-screen):
A closer look at the startup
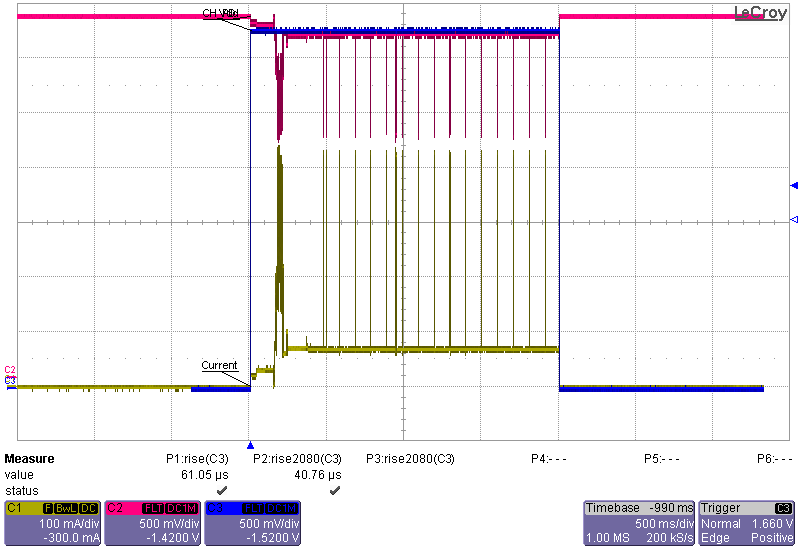
We already know the trouble happens at startup, with a large burst of current spikes. I’m not sure what is the exact cause, be it the SPI peripheral loading user code from the flash, the radio warming up, or some other arcane inner workings of the ESP8266.
One thing is clear–this is where the fault state occurs.
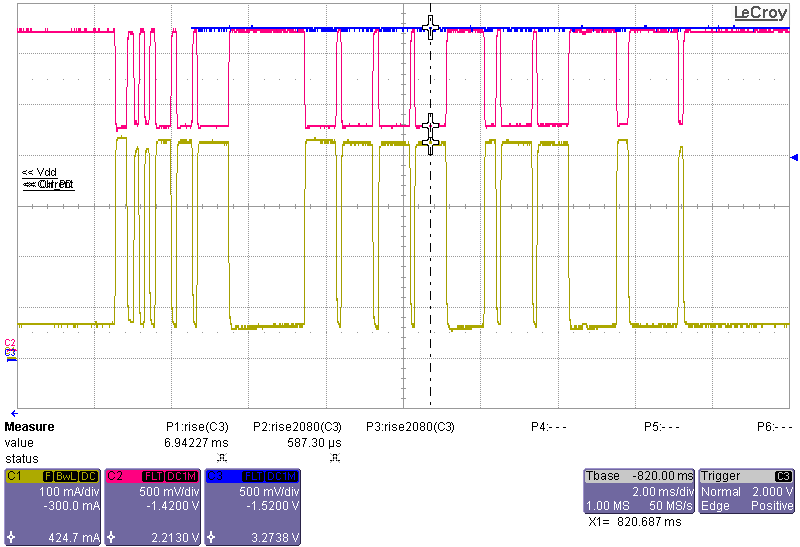
Let’s have a look at the current profile:
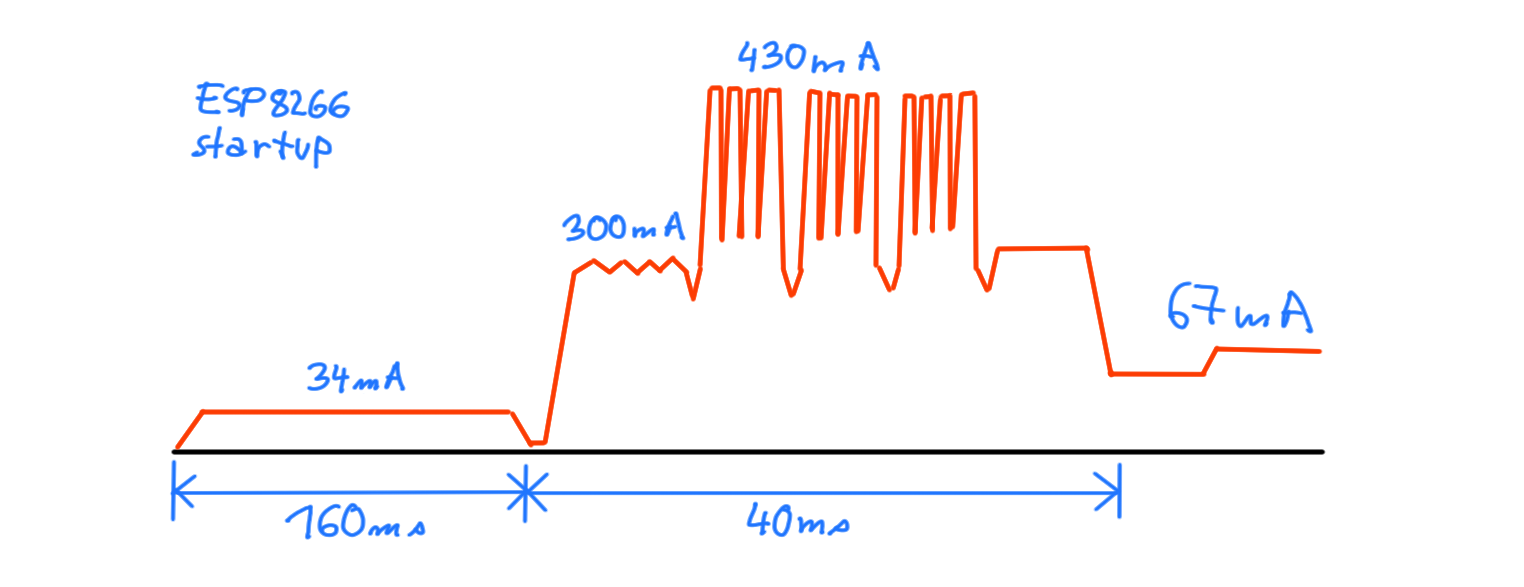
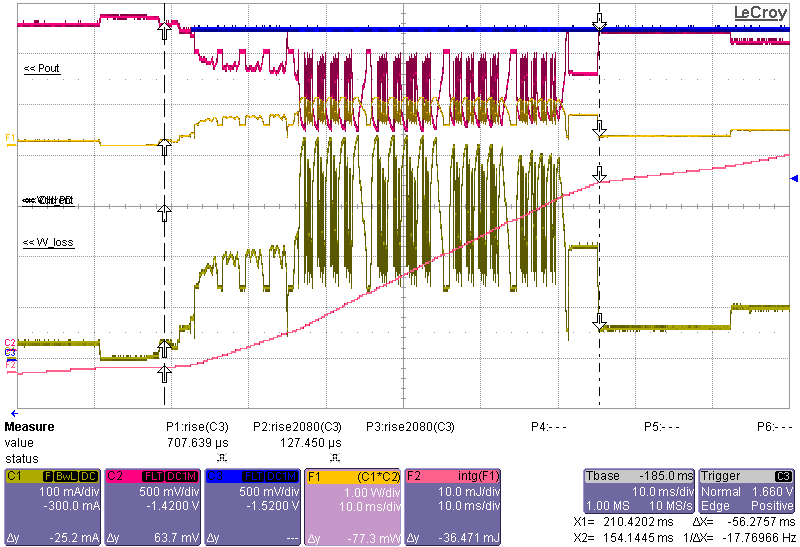
During the initial “plateau”, any blocking capacitors have a chance to charge to get ready for the burst. After those 160 ms, there are 40 ms of current draw between 300 mA and 430 mA, which is where the largest Vdd droop occurs.
Here are some screenshots from the scope (click to magnify and see descriptions):

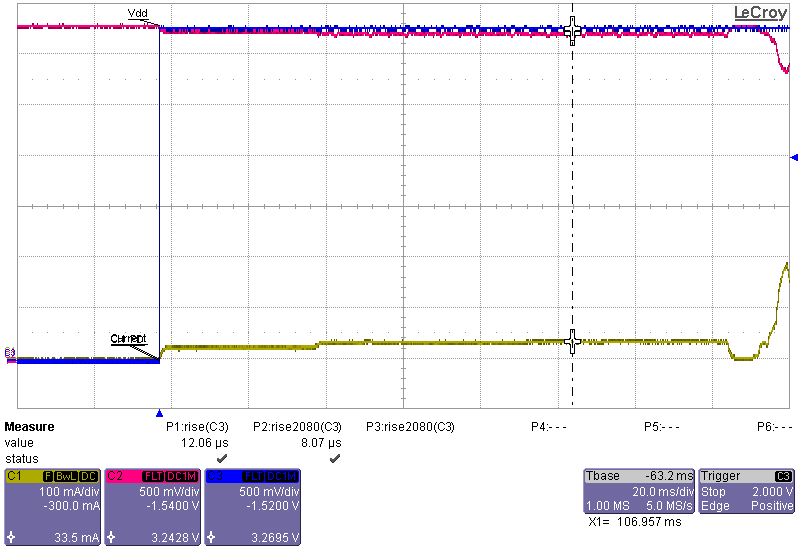
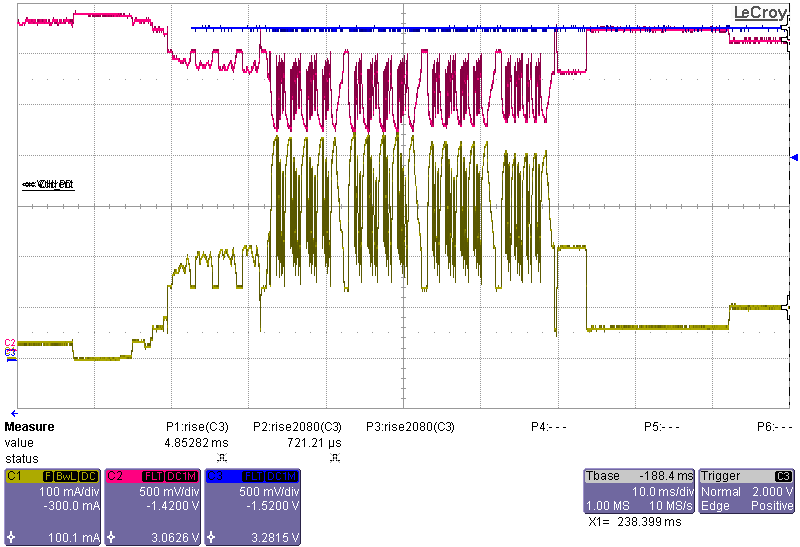
Just cause the scope can do that, I also calculated the energy consumed during the startup burst - W=36 mJ. This could be used to calculate the necessary blocking capacitors.
It appears the application code can start no earlier than about 230 ms after the power goes on, which si something to consider when designing an external watchdog (discussed in the previous article).
Idle consumption
My measurements of the idle consumption are summed up in the following table:
| State | Consumption |
|---|---|
| Power down | 200 µA |
| Active, WiFi OFF | 34 mA |
| WiFi ON | 67 mA + 435 mA spikes |
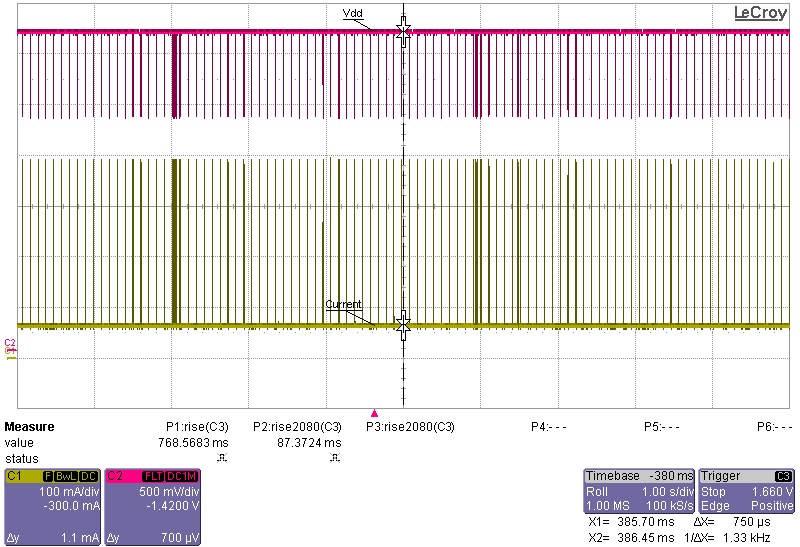
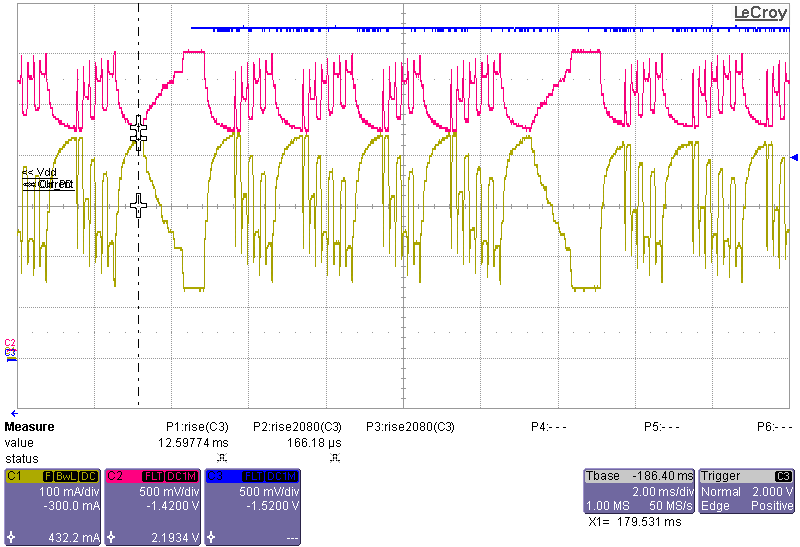
Here come some supporting screenshots–notice the periodic spikes. They occur every 100 ms and are about 700 us long, with some denser bursts occuring randomly. Those could be caused by reads from the flash, or–more likely–WiFi beacon frames (or some other such technicality).
The last picture details one of those dense bursts you can see in the second picture. The pulses are similar to the normal pulses (which I forgot to take a screenshot of), but much closer together. This poses a problem to blocking capacitors, and you’ll see larger voltage dips during those bursts.
Each of the regular pulses corresponds to the consumption of 760 µJ.